
When large strategic transformation projects take place in companies, there is often an initial decline in performance. This article is about possible reasons for this and how to close this performance gap.
How changes typically happen
When we talk about strategic realignments and transformations, we are undoubtedly talking about challenging projects. Each of these projects is unique and differs from other projects in both the initial situation and the goals to be achieved. Nevertheless, some models have become established in management that represent ideal-typical processes of change.
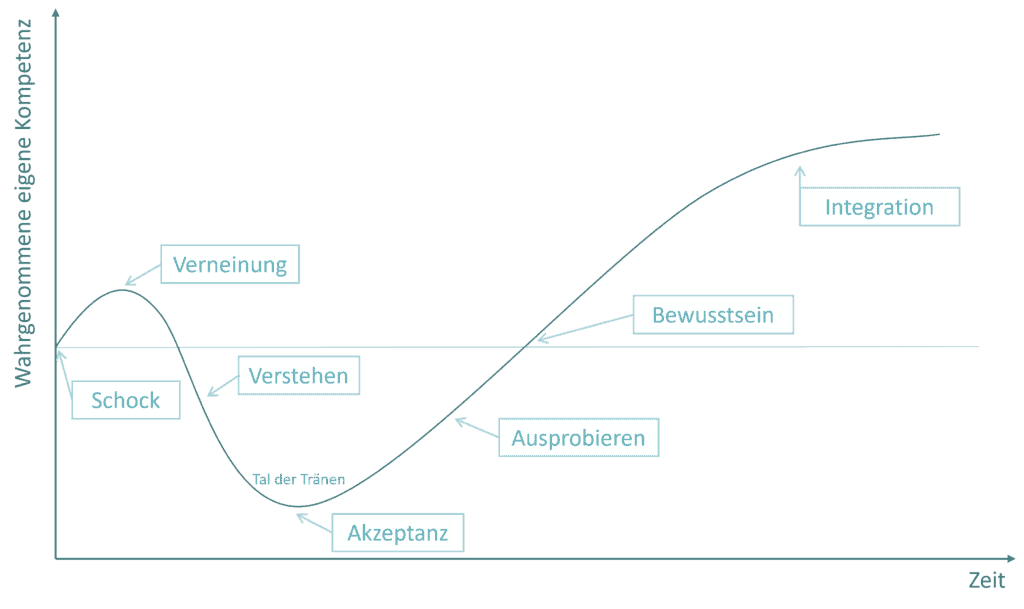
One of these models is the change curve according to Elisabeth Kübler-Ross, a Swiss-US psychiatrist.
Her insights originated in the late 1960s, in the observation of dying and grieving people. Later it was modified and also applied as a model of individual change processes. Are change management and deep grief really that close?🤔
Why so negative?
Even though Kübler-Ross’ presentation is a topic in many trainings for executives and change managers, in my personal experience the findings can only be partially transferred to individual performance in practice. In particular, you do not necessarily encounter the early stages, such as the appearance of shock, defensiveness, or mourning for the old solution.
The terms used in the model already suggest negative associations. In the case of changes that are accompanied by fears of job or reputation loss, or transfer to a different work location and thus less free time and higher costs, this may still be true. But what if, for example, a company wanted to develop a model for a 4-day workweek because it hoped to increase productivity and employee retention? I am sure that in this case, at first, not only negative thoughts and rejection will be expressed.
In the end, it is the case that each person individually evaluates whether a change brings positive or negative effects. The motives and attitudes of the people involved and the emotions that result are very different.
The influence of different forces
Another model for describing change comes from Kurt Lewin, a German social psychologist. His findings are even further back in time but they still have a lot of influence when it comes to understanding change processes. In his 3-phase model, Lewin depicts the progression of performance as a function of time as similar to Kübler & Ross. However, it does not refer to individual performance, but to organizational performance. It abstracts to three essential phases (unfreezing > moving/changing> refreezing). Lewin also refers to his field theory in the model. This describes the existence of two fundamental forces. One force resists change and wants to maintain the status quo, while the other supports change. More about these forces later. A personal criticism of Lewin’s model is his choice of the term “freezing.” This contradicts the fact that companies are (have to be) constantly evolving and would be equally at odds with continuous improvement.
You have to be aware that both models are just that, models: Models. They are abstract and reduced. Changes are complex processes that cannot be fully explained by ideal-typical phase models.
Let’s take a look at both models in comparison:
Change Kurve nach Kubler-Ross

3-Phasen Modell nach Kurt Lewin
While Kübler-Ross’ model focuses on individual emotions, Lewin looks more at the organizational level in change. Another model with a comparable performance/time trajectory is Virginia Satir’s 5-Phase Model (Status Quo, Resistance, Chaos, Integration, New Status Quo), which comes from the field of family change. Systemic elements and interpersonal relationships are at the center of their consideration.
The power of habit
In comparison, it can be seen that all models, although they each follow a slightly different approach, show a qualitatively similar curve progression with the following characteristics:
- A decline in performance after the onset of the change
- A turning point from which the power increases again
- The point at which previous performance is regained
- The level of performance that is achieved after successful change
This progression is easy to follow even without an empirical basis. People are usually more efficient with familiar and preferred methods. If the area of the usual is left and new methods or procedures are to be applied, then these often do not provide the desired result from the beginning. Only with acceptance and increasing routine, a new (and ideally higher) level of performance sets in. The term “learning curve” is very applicable here.
Try writing your name with a hand other than the one you are used to. Very likely, your name will be decipherable. However, compared to the way you are used to writing, it will take you longer, it will be more tiring and visually it will not be the result you would want. With a little practice, the result then becomes increasingly better (although perhaps not better than with the usual hand). Perhaps you also remember your first attempts at writing with a keyboard. Compare the error rate of their first “walking attempts” with their current abilities.
Another reason is that the change project is usually carried out in parallel with ongoing day-to-day business. Time spent in the organization for project meetings and workshops is missing in the operational area. This effect is particularly noticeable in smaller companies, where employees are assigned both operational and project tasks and there is no “full-time” project management.
In some plots, one can still find a temporary increase in performance in the curves before it decreases. In some cases, you can see this effect well. There are two main practical explanations for this. Either performance increases due to rejection, demonstrating that no change is necessary because what exists is delivering good results. Positive causes are also possible, for example due to initial euphoria in the case of changes desired or advocated by the majority.
The optimized curve progression
If we therefore assume that successful changes ideally correspond to the curve shown, then we can quickly determine how the curve could be optimized:
- Minimization of the power drop
- Minimize the time to reach the turning point (see point 2 above).
- Minimize the time to reach the new performance level
- Maximize performance improvement over status quo performance.
These measures could reduce the overall performance lost in the change process. Based on a structured process, the likelihood of a more usable result and thus long-term added value also increases. Not taking advantage of this lead would also represent an opportunity loss of organizational performance. The figure below illustrates this. I have seen a similar illustration in several publications and training materials. Unfortunately, the exact origin is not known to me. Of course, a necessary condition is that the chosen change is fundamentally capable of increasing performance and that the project is carried out to this point and does not lose attention halfway and is abandoned.

Reduce performance losses through a systematic approach
The effect of force fields
As already mentioned, Kurt Lewin describes in his force model that there are driving forces that support this optimization and forces that counteract it. Lewin also already theorized that the counteracting forces must be reduced in order to reduce the effort required for the supporting forces to a feasible level. And there is another reason: For example, due to high counteracting forces, there is a risk that the organization will fall back into old patterns and to its previous performance as soon as there is even a small decrease in supporting forces.
So if we reduce the counteracting forces, it will be easier for us to generate the necessary supporting forces to favor change and keep the performance gap low.
What does that mean in practice?
For practical purposes, I would like to make 5 basic recommendations, each of which must of course be seen in the context of the change task before you:
- First, think about the counteracting forces that are present. What are the resistances and how can they be countered? Clarify this issue before defining their supporting actions.
- Do not transfer your personal assessment of the change to others. Otherwise, you run the risk of overlooking important opposition or potential supporters. Tools such as the “empathy map”, the “acceptance matrix” or systemic methods can support you in your reflection.
- Resistance and rejection can help you find possible “set screws”. To do this, work out in particular the context in which rejection occurs.
- Your organization’s lived practices and existing policies and processes can also be forces that stand in the way of change. For example, if you want to establish an open culture of error, but managers regularly threaten personnel measures, this is a contradiction that needs to be addressed.
- A systematic and methodical approach will help you achieve the above optimization goals. So don’t start a change project without a clear system.
Image source:
Costello77 / stock.adobe.com
Own illustration


